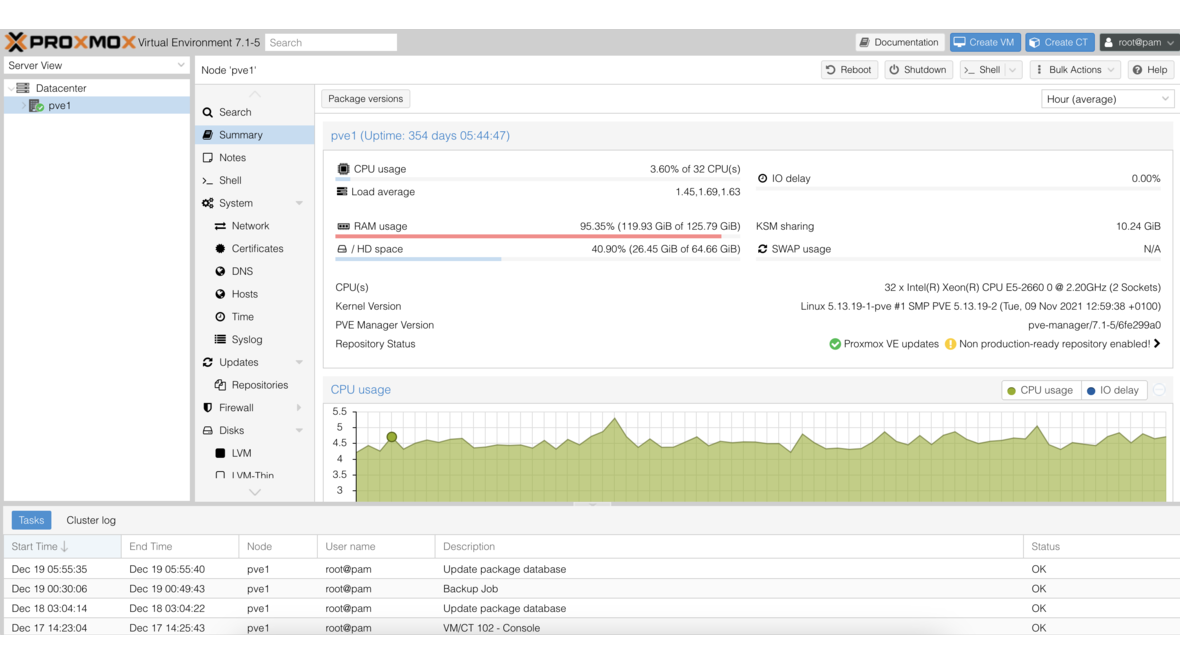
Prometheus sammelt Metriken, Grafana visualisiert sie — zusammen bilden sie einen der leistungsfähigsten Open-Source-Monitoring-Stacks. Im Gegensatz zu All-in-One-Lösungen wie Zabbix verfolgt der Prometheus/Grafana-Stack einen modularen Ansatz: Jede Komponente macht eine Sache gut. Dieser Artikel zeigt, wie Sie den Stack für eine typische KMU-Infrastruktur mit Proxmox, Linux-Servern und OPNsense aufbauen.
Architektur-Überblick
┌─────────────┐     ┌─────────────┐     ┌─────────────┐
│ Linux Server│     │ Proxmox VE  │     │  OPNsense   │
│ node_export │     │ pve-exporter│     │ SNMP Agent  │
│  :9100      │     │  :9221      │     │  :161/udp   │
└──────┬──────┘     └──────┬──────┘     └──────┬──────┘
       │                   │                   │
       └───────────┬───────┴───────────────────┘
                   │
            ┌──────▼──────┐
            │  Prometheus  │
            │  :9090       │
            └──────┬──────┘
                   │
            ┌──────▼──────┐
            │   Grafana    │
            │  :3000       │
            └─────────────┘
Prometheus scraped (zieht) Metriken von den Exportern in einem konfigurierbaren Intervall. Grafana fragt die Prometheus-Datenbank ab und stellt die Ergebnisse in Dashboards dar.
Prometheus installieren
Installation auf Debian/Ubuntu
# Benutzer und Verzeichnisse anlegen
useradd --no-create-home --shell /bin/false prometheus
mkdir -p /etc/prometheus /var/lib/prometheus
chown prometheus:prometheus /var/lib/prometheus

# Prometheus herunterladen und installieren
PROM_VERSION="2.53.0"
wget https://github.com/prometheus/prometheus/releases/download/v${PROM_VERSION}/prometheus-${PROM_VERSION}.linux-amd64.tar.gz
tar xzf prometheus-${PROM_VERSION}.linux-amd64.tar.gz
cp prometheus-${PROM_VERSION}.linux-amd64/{prometheus,promtool} /usr/local/bin/
cp -r prometheus-${PROM_VERSION}.linux-amd64/{consoles,console_libraries} /etc/prometheus/
chown -R prometheus:prometheus /etc/prometheus
Systemd-Service erstellen
# /etc/systemd/system/prometheus.service
[Unit]
Description=Prometheus Monitoring
Wants=network-online.target
After=network-online.target

[Service]
User=prometheus
Group=prometheus
Type=simple
ExecStart=/usr/local/bin/prometheus \
  --config.file=/etc/prometheus/prometheus.yml \
  --storage.tsdb.path=/var/lib/prometheus/ \
  --storage.tsdb.retention.time=90d \
  --web.enable-lifecycle
ExecReload=/bin/kill -HUP $MAINPID
Restart=always

[Install]
WantedBy=multi-user.target
systemctl daemon-reload
systemctl enable --now prometheusBasis-Konfiguration
# /etc/prometheus/prometheus.yml
global:
  scrape_interval: 15s
  evaluation_interval: 15s

rule_files:
  - "alerts/*.yml"

alerting:
  alertmanagers:
    - static_configs:
        - targets:
            - "localhost:9093"

scrape_configs:
  - job_name: "prometheus"
    static_configs:
      - targets: ["localhost:9090"]
Exporter einrichten
node_exporter (Linux-Server)
Der node_exporter liefert CPU, RAM, Disk, Netzwerk und hunderte weitere System-Metriken:
# Installation
NODE_VERSION="1.8.1"
wget https://github.com/prometheus/node_exporter/releases/download/v${NODE_VERSION}/node_exporter-${NODE_VERSION}.linux-amd64.tar.gz
tar xzf node_exporter-${NODE_VERSION}.linux-amd64.tar.gz
cp node_exporter-${NODE_VERSION}.linux-amd64/node_exporter /usr/local/bin/

# Systemd Service
cat <<EOF > /etc/systemd/system/node_exporter.service
[Unit]
Description=Node Exporter
After=network.target

[Service]
User=node_exporter
Type=simple
ExecStart=/usr/local/bin/node_exporter \
  --collector.systemd \
  --collector.processes \
  --collector.tcpstat

[Install]
WantedBy=multi-user.target
EOF

useradd --no-create-home --shell /bin/false node_exporter
systemctl daemon-reload
systemctl enable --now node_exporter
Prometheus-Konfiguration ergänzen:
scrape_configs:
  - job_name: "linux-servers"
    static_configs:
      - targets:
          - "server-web-01:9100"
          - "server-db-01:9100"
          - "server-app-01:9100"
        labels:
          environment: "production"
Proxmox VE Exporter
Der prometheus-pve-exporter liest die Proxmox-API aus und liefert VM-Status, Ressourcenverbrauch und Cluster-Metriken:
pip install prometheus-pve-exporter

# Konfiguration
cat <<EOF > /etc/prometheus/pve.yml
default:
  user: monitoring@pve
  password: "MonitoringPasswort"
  verify_ssl: false
EOF

# Systemd Service
cat <<EOF > /etc/systemd/system/pve-exporter.service
[Unit]
Description=Proxmox VE Exporter
After=network.target

[Service]
User=prometheus
Type=simple
ExecStart=/usr/local/bin/pve_exporter /etc/prometheus/pve.yml

[Install]
WantedBy=multi-user.target
EOF

systemctl daemon-reload
systemctl enable --now pve-exporter
Prometheus-Konfiguration:
  - job_name: "proxmox"
    metrics_path: /pve
    params:
      module: [default]
      cluster: ["1"]
      node: ["1"]
    static_configs:
      - targets:
          - "proxmox-01.local"
    relabel_configs:
      - source_labels: [__address__]
        target_label: __param_target
      - source_labels: [__param_target]
        target_label: instance
      - target_label: __address__
        replacement: "localhost:9221"
SNMP-Exporter für OPNsense
OPNsense liefert Netzwerk-Metriken über SNMP. Der SNMP-Exporter übersetzt diese in das Prometheus-Format:
# SNMP-Exporter installieren
SNMP_VERSION="0.26.0"
wget https://github.com/prometheus/snmp_exporter/releases/download/v${SNMP_VERSION}/snmp_exporter-${SNMP_VERSION}.linux-amd64.tar.gz
tar xzf snmp_exporter-${SNMP_VERSION}.linux-amd64.tar.gz
cp snmp_exporter-${SNMP_VERSION}.linux-amd64/snmp_exporter /usr/local/bin/
OPNsense SNMP aktivieren: Services > SNMP > Enable SNMP, Community-String setzen.
Prometheus-Konfiguration:
  - job_name: "opnsense-snmp"
    static_configs:
      - targets:
          - "192.168.1.1"
    metrics_path: /snmp
    params:
      auth: [public_v2]
      module: [if_mib]
    relabel_configs:
      - source_labels: [__address__]
        target_label: __param_target
      - source_labels: [__param_target]
        target_label: instance
      - target_label: __address__
        replacement: "localhost:9116"
Grafana installieren und einrichten
# Grafana Repository hinzufügen (Debian/Ubuntu)
apt-get install -y apt-transport-https software-properties-common
wget -q -O /usr/share/keyrings/grafana.key https://apt.grafana.com/gpg.key
echo "deb [signed-by=/usr/share/keyrings/grafana.key] https://apt.grafana.com stable main" > /etc/apt/sources.list.d/grafana.list

apt-get update
apt-get install grafana

systemctl enable --now grafana-server
Prometheus als Datenquelle
Nach dem Login (Standard: admin/admin) unter Configuration > Data Sources > Add:
- Typ: Prometheus
- URL:
http://localhost:9090 - Save & Test
Dashboards importieren
Grafana bietet tausende Community-Dashboards. Die wichtigsten für unseren Stack:
| Dashboard | Grafana ID | Beschreibung |
|---|---|---|
| Node Exporter Full | 1860 | Umfassendes Linux-Server-Dashboard |
| Proxmox VE | 10347 | VM-Status und Cluster-Übersicht |
| SNMP Interface | 11169 | Netzwerk-Interface-Statistiken |
| Prometheus Stats | 3662 | Prometheus-eigene Metriken |
Import unter Dashboards > Import > ID eingeben > Load.
Eigene Dashboards erstellen
Für ein KMU-Übersichtsdashboard erstellen Sie ein neues Dashboard mit folgenden Panels:
Server-CPU-Auslastung:
100 - (avg by (instance) (rate(node_cpu_seconds_total{mode="idle"}[5m])) * 100)RAM-Nutzung in Prozent:
(1 - node_memory_MemAvailable_bytes / node_memory_MemTotal_bytes) * 100Disk-Belegung:
(1 - node_filesystem_avail_bytes{mountpoint="/"} / node_filesystem_size_bytes{mountpoint="/"}) * 100Netzwerk-Durchsatz:
rate(node_network_receive_bytes_total{device="eth0"}[5m]) * 8Alerting einrichten
Alertmanager installieren
AM_VERSION="0.27.0"
wget https://github.com/prometheus/alertmanager/releases/download/v${AM_VERSION}/alertmanager-${AM_VERSION}.linux-amd64.tar.gz
tar xzf alertmanager-${AM_VERSION}.linux-amd64.tar.gz
cp alertmanager-${AM_VERSION}.linux-amd64/alertmanager /usr/local/bin/
Konfiguration:
# /etc/prometheus/alertmanager.yml
route:
  group_by: ['alertname', 'instance']
  group_wait: 30s
  group_interval: 5m
  repeat_interval: 4h
  receiver: 'email'

receivers:
  - name: 'email'
    email_configs:
      - to: 'admin@unternehmen.de'
        from: 'alertmanager@unternehmen.de'
        smarthost: 'smtp.unternehmen.de:587'
        auth_username: 'alertmanager'
        auth_password: 'smtp-passwort'
Alert-Regeln definieren
# /etc/prometheus/alerts/infrastructure.yml
groups:
  - name: infrastructure
    rules:
      - alert: HighCPUUsage
        expr: 100 - (avg by (instance) (rate(node_cpu_seconds_total{mode="idle"}[5m])) * 100) > 90
        for: 10m
        labels:
          severity: warning
        annotations:
          summary: "High CPU on {{ $labels.instance }}"
          description: "CPU usage above 90% for 10 minutes."

      - alert: DiskSpaceLow
        expr: (1 - node_filesystem_avail_bytes{mountpoint="/"} / node_filesystem_size_bytes{mountpoint="/"}) * 100 > 85
        for: 5m
        labels:
          severity: critical
        annotations:
          summary: "Low disk space on {{ $labels.instance }}"
          description: "Root partition at {{ $value | printf \"%.1f\" }}%."

      - alert: HostDown
        expr: up == 0
        for: 2m
        labels:
          severity: critical
        annotations:
          summary: "Host {{ $labels.instance }} is down"

      - alert: HighMemoryUsage
        expr: (1 - node_memory_MemAvailable_bytes / node_memory_MemTotal_bytes) * 100 > 90
        for: 10m
        labels:
          severity: warning
        annotations:
          summary: "High memory on {{ $labels.instance }}"
Retention und Storage-Planung
Prometheus speichert Metriken lokal im TSDB-Format. Die Retention wird über --storage.tsdb.retention.time gesteuert:
| Retention | Speicherbedarf (100 Metriken, 15s Intervall) |
|---|---|
| 15 Tage | ca. 2 GB |
| 30 Tage | ca. 4 GB |
| 90 Tage | ca. 12 GB |
| 365 Tage | ca. 45 GB |
Für Langzeit-Storage empfiehlt sich Thanos oder VictoriaMetrics als Remote-Write-Backend. Prometheus bleibt dann der lokale Kollektor mit kurzer Retention (15-30 Tage), Langzeitdaten lagern in einem skalierbaren Backend.
Vergleich: Prometheus/Grafana vs. Zabbix
| Merkmal | Prometheus + Grafana | Zabbix |
|---|---|---|
| Architektur | Pull (Prometheus scraped) | Push & Pull |
| Datenmodell | Time-Series (Labels) | Items & Triggers |
| Visualisierung | Grafana (exzellent) | Integriert (funktional) |
| Konfiguration | YAML / Code | Web-GUI |
| Auto-Discovery | Service Discovery | Network Discovery |
| Alerting | Alertmanager (flexibel) | Integriert (umfangreich) |
| Skalierung | Horizontal (Thanos) | Proxies & Partitioning |
| Lernkurve | Hoch (PromQL) | Mittel (GUI-basiert) |
| Ideal für | DevOps / Cloud-native | Klassische IT-Infrastruktur |
Für Unternehmen mit bestehender DevOps-Kultur und Container-Workloads ist Prometheus/Grafana oft die bessere Wahl. Für klassische IT-Infrastruktur mit vielen SNMP-Geräten bietet Zabbix den niedrigeren Einstieg.
Monitoring mit DATAZONE Control
DATAZONE Control bietet eine Monitoring-Lösung, die die Stärken beider Welten vereint: automatische Agent-Erkennung wie Zabbix, flexible Dashboards wie Grafana, und nahtlose Integration mit Proxmox, TrueNAS und OPNsense. Für Unternehmen, die einen betriebsbereiten Monitoring-Stack ohne den Konfigurationsaufwand von Prometheus/Grafana benötigen, ist DATAZONE Control die effizientere Alternative.
Häufig gestellte Fragen
Kann ich Prometheus und Zabbix parallel betreiben?
Ja. Prometheus und Zabbix stören sich nicht gegenseitig. Viele Unternehmen nutzen Zabbix für die klassische Infrastruktur und Prometheus für Container und Cloud-Workloads.
Wie sichere ich den Prometheus-Zugang ab?
Prometheus hat keine eingebaute Authentifizierung. Nutzen Sie einen Reverse-Proxy (nginx, Caddy) mit Basic Auth oder OAuth2. Alternativ bietet Grafana eigene Benutzerkontrollen.
Reicht Prometheus allein, ohne Grafana?
Prometheus hat eine integrierte Web-UI für Ad-hoc-Queries, aber keine Dashboard-Funktionalität. Für produktives Monitoring ist Grafana praktisch unverzichtbar.
Sie möchten einen Monitoring-Stack für Ihre Infrastruktur aufbauen? Kontaktieren Sie uns — wir implementieren Prometheus, Grafana oder DATAZONE Control für Ihr Unternehmen.
Mehr zu diesen Themen:
Weitere Artikel
TrueNAS-Proxmox-Plugin verlaesst die Vorankuendigung: Early-Adopter-Rollout mit signiertem APT-Repo
iXsystems hat den TrueNAS-Storage-Plugin-Rollout fuer Proxmox VE konkret gemacht: signierte APT-Pakete fuer Bookworm und Trixie, cluster-bewusster Installer, Multi-Tenancy und offizieller Early-Adopter-Status. Was neu ist, was das im Alltag heisst und wo die Grenzen liegen.
Proxmox Datacenter Manager 2026: der Praxis-Stand nach einem Jahr
Was der Proxmox Datacenter Manager -- PDM -- 2026 wirklich kann: Multi-Cluster-Ueberblick, zentrale Migration, SSO. Was noch fehlt vs. vCenter. Praxis-Update aus dem Systemhaus.
Proxmox Lizenz Kosten vs. VMware und Hyper-V: die ehrliche Kostenrechnung 2026
Proxmox Lizenz Kosten, VMware VVF pro Core, Hyper-V Datacenter plus CAL: ehrlicher Groessenordnungs-Vergleich 2026, ohne erfundene EUR-Beispiele. Praxisblick aus DATAZONE-Beratungen.